The Metroverse uses quantitative data that can help describe the types of industries and businesses operating in a city and help reveal the city’s productive capabilities, industry specializations, and potential for economic diversification. The data was gathered, analyzed, and presented by a large group of researchers from the Harvard Growth Lab. Some big names listed in the project are Annie White, the director, Brendan Leonard, the Senior Back End & Data Developer, and Nil Tuzcu, the Senior Designer. They primarily used Dun & Bradstreet’s WorldBase database, which contains information on more than 100 million business establishments worldwide. They then gathered, cleaned, and presented the information in an easily understandable and interactive way that allows a wide range of audiences to use the information as they please.
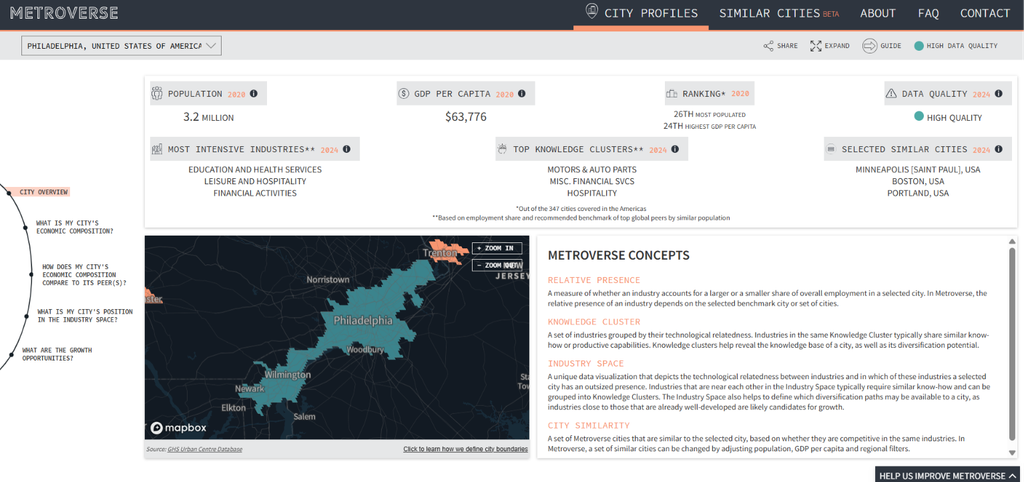
When you initially click on a city you’d like to research, the project lists information such as population, GDP per capita, and where the city ranks among others. Here is what shows up initially.
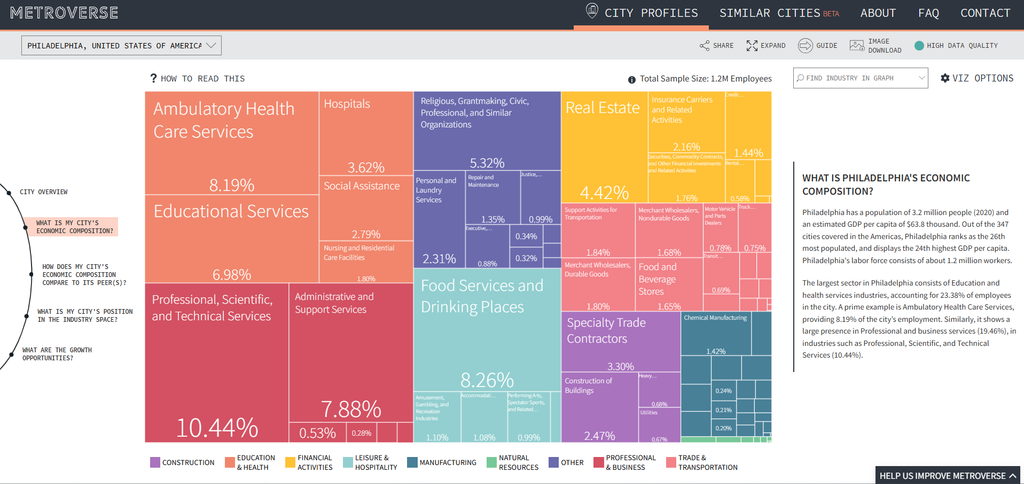
Looking at the left, you can see that there are more interactive slides to click on. When clicking on, “What is my city’s economic composition”, a large interactive grid shows up, visually showing the most impactful sectors that make a city great.
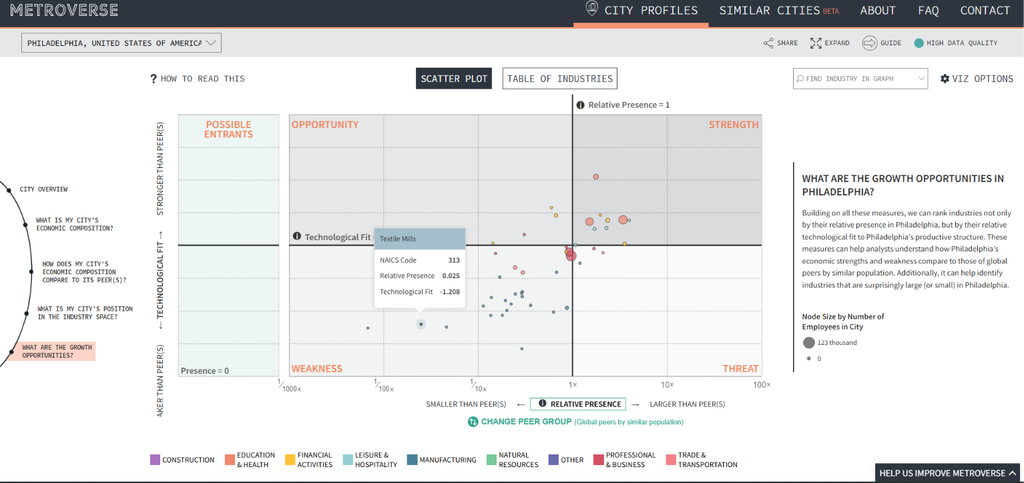
The last slide on the left identifies potential growth opportunities that policymakers and government workers can look into. Here is what shows up when exploring the page.