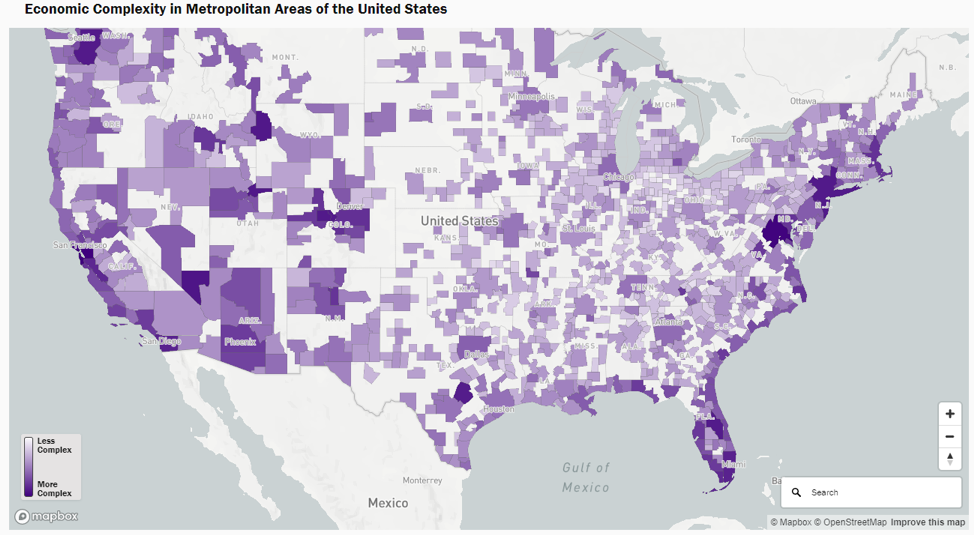
- The map is based on large datasets and also uses digital visualization elements that support a vision of Digital Humanities, in which data is told and could be understood
- Economic complexity is closely associated with the growth of income, investment appeal, and long-term financial performance of regions.
- Higher-skilled labor, venture capital, and institutional investment are attracted to the more complex areas.
- At the local and national level, this site shows how data visualization can influence policy decisions and financial strategy.
- It connects quantitative economic modeling (finance) with digital mapping and visualization tools (DHM).
- The interactive map format lets the viewer explore geographic disparities in opportunity for finance, showing it is divided up geographically.
- Dark areas indicate higher economic complexity with generally corresponding to stronger GDP growth and higher wages