Charles D. Thompson created the website in order to compliment the book he wrote. The interactive map brings an association of a real place in time, helping better understand the book. The map contains a yellow line that represents the Mexican/US border; along this border the various towns/cities are clickable links that lead to a slideshow of pictures of that specific location, the people and notable things about the border pertaining to that city/town. The slideshow is voiced over by a male who I presume is Thompson and is also accompanied with written text. There are also brief captions under the photos in the slideshow. Below are two screenshots that show the full length of the map with the locations listed to the right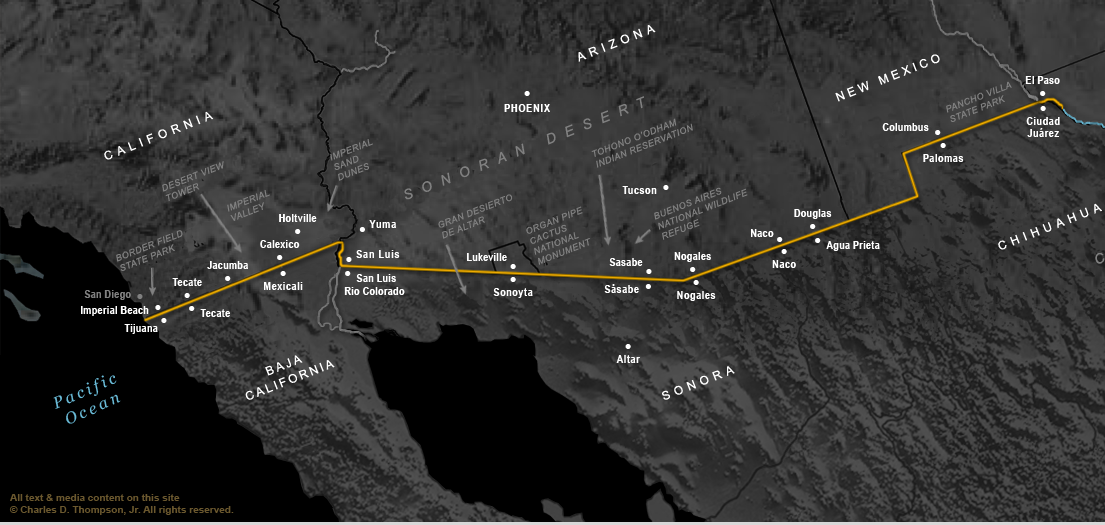
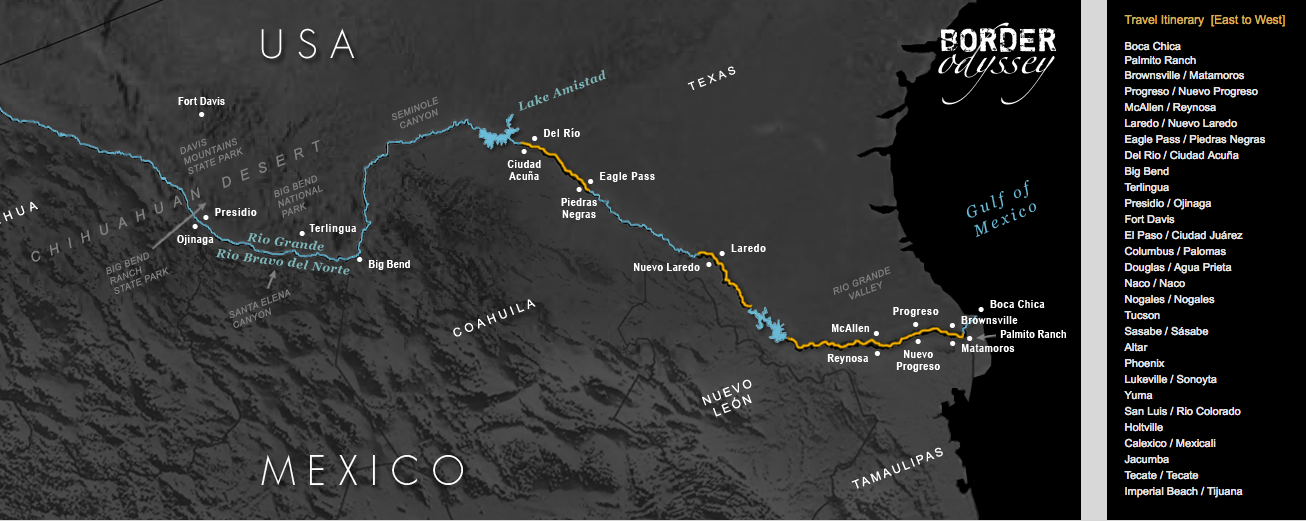
It is not totally clear how the map was created. As far as interacting with the map, you can scroll left to right (if on a screen that doesn’t already fit the full length of the map), but it does not have many of the features that other digital maps have. The map does not have a zoom feature, spatial accuracy is not able to be determined, and the level of accuracy of the source data is not available. The map appears to be more of an image over HTML text, and users are blocked from right-clicking; this demonstrates how this map falls short in actually functioning as an interactive map.
This project does well in teaching aspects of culture from the places Thompson visited, informing users about the history and really makes us aware of the mistreatment and political corruption that exists at the border. The map takes captivating photos from the book to create a digital form of the content. The digital features are limited, and due to not revealing many of his methods and not crediting others, data scientists and digital humanities scholars may find this project doesn’t answer a lot of their questions.