
D3 (Data-Driven Documents) is a JavaScript library that binds data to DOM elements and applies data-driven transformations making it the standard tool for custom, interactive data visualization on the web. For CreditPath, D3 would power three key things:
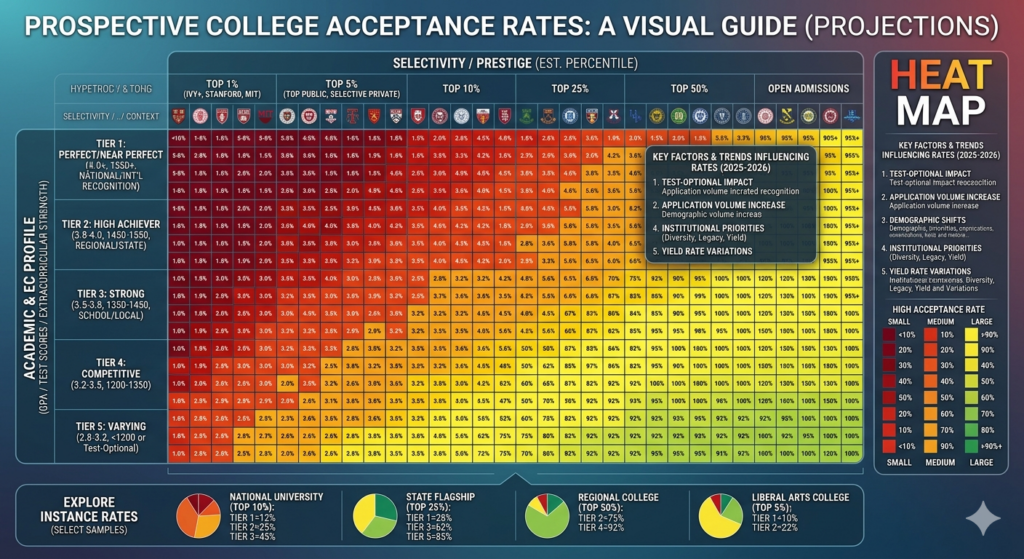
Acceptance heat map: A department-by-state grid showing credit acceptance rates
Sankey diagram: Tracks the flow of credits from sending institutions to WCU outcomes: accepted, denied, or pending review

Timeline chart: Shows how acceptance rates have changed year over year across departments and regions
I used Google Gemini to create these images to demonstrate what the heat map and diagram might look like.