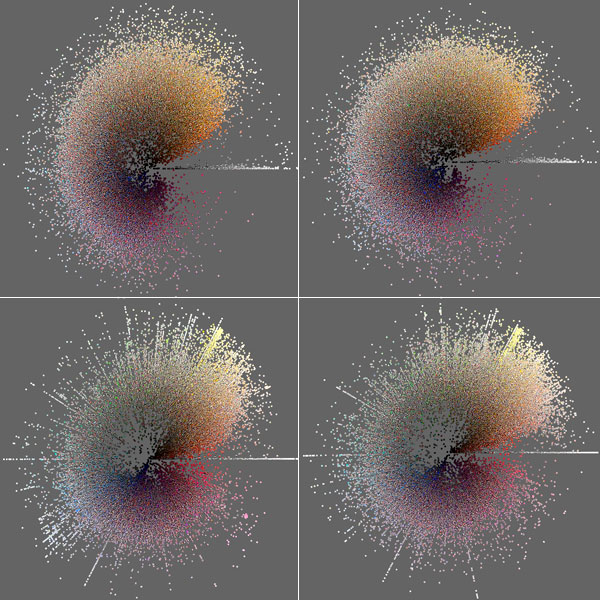
This project was able to successfully visualize major cities and social media habits within them. The project meets best practices and shows data in an aesthetic way that we haven’t seen before, even if the cultural patterns aren’t the clearest.

Cultural Analytics
- This changed the analysis field and allowed researchers to look at millions of photos across cities. They are also able to look at both user habits and large cultural patterns.
- They can use metadata to organize based on timestamps and geolocation data to best analyze the images. This meets their best practices and gave us ways to see data that we hadn’t before.

Visualization Layouts
- Phototrials moved from traditional points and lines to using photos in their visualizations. This meets their best practices and changed the way we can see data. They are able to use Mosaics to arrange by timeline or scatter plots to arrange based on hue and brightness. They can also use radial layouts, which are circular arrangements, to look at 24-hour patterns and see visuals over the course of time or to see color differences (shown below).