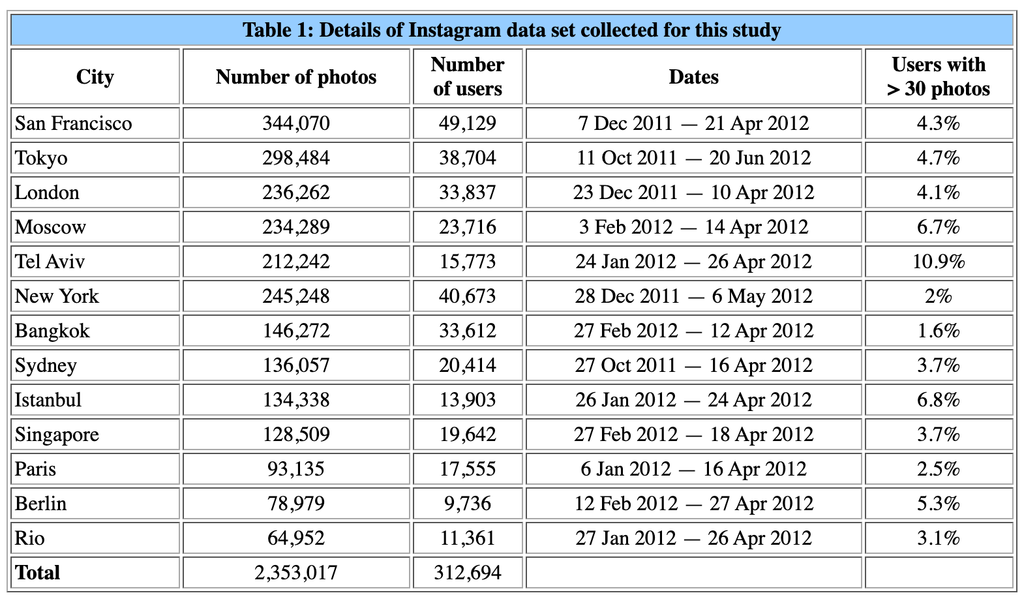
The photos are taken from public Instagram photos, and the metadata is collected across 13 cities. They are then grouped based on location. Then it is turned into a visualization using one of the visualization plot types, based on time, location, and color spectrum. Researchers can then use these visualizations to identify cultural patterns in one of the 13 cities studied. All of these steps are heavily documented, and they even include different types of visualization to see the data in different ways.
In the Phototrails publication, they discuss the step of how they pick their Instagram photos. They choose the photos based on the geospatial coordinates and timestamps added to the photos taken and posted on Instagram. All the photos have the same resolution, and since they have filter options in the app, they can sort based on that to give the images a standardized appearance. Using Instagram’s API, they are able to collect images from 13 cities around the world and set parameters to best analyze the images. (Source)