Project Overview
Visualizing Economic Inequality through charts, maps and narratives. Highlighting disparities in income, employment, housing and education.
Our goal is to provide accessible and exceptional education to students around the world. Join us today and be part of our mission!

SOCIAL JUSTICE
Economic Inequality is a major social justice issue that affects access to education, healthcare, and opportunity.

Key Analysis
We highlighted how income disparities in the West Chester Area disproportionately affect lower income and marginalized communities. Visualizing this data raises awareness and hopefully change.

Groups and Issues
Low Income Households
Students with Financial Barriers
Local Minority Communities
Wage gaps, housing affordability, access to resources
Goal 1:
Analyze and Interpret Economic Data
By transforming raw data into visualizations users will be able to interpret trends in income, unemployment and housing allowing them to create a connection and understand the disparity.
Goal 2:
Preserve, Publish, and provide access to Economic Data
By collecting and organizing local economic data into this project it ensures that information about the community’s economic condition isn’t lost.
DATA
Types of Data
Household Income, Employment, Housing Costs, Education Levels
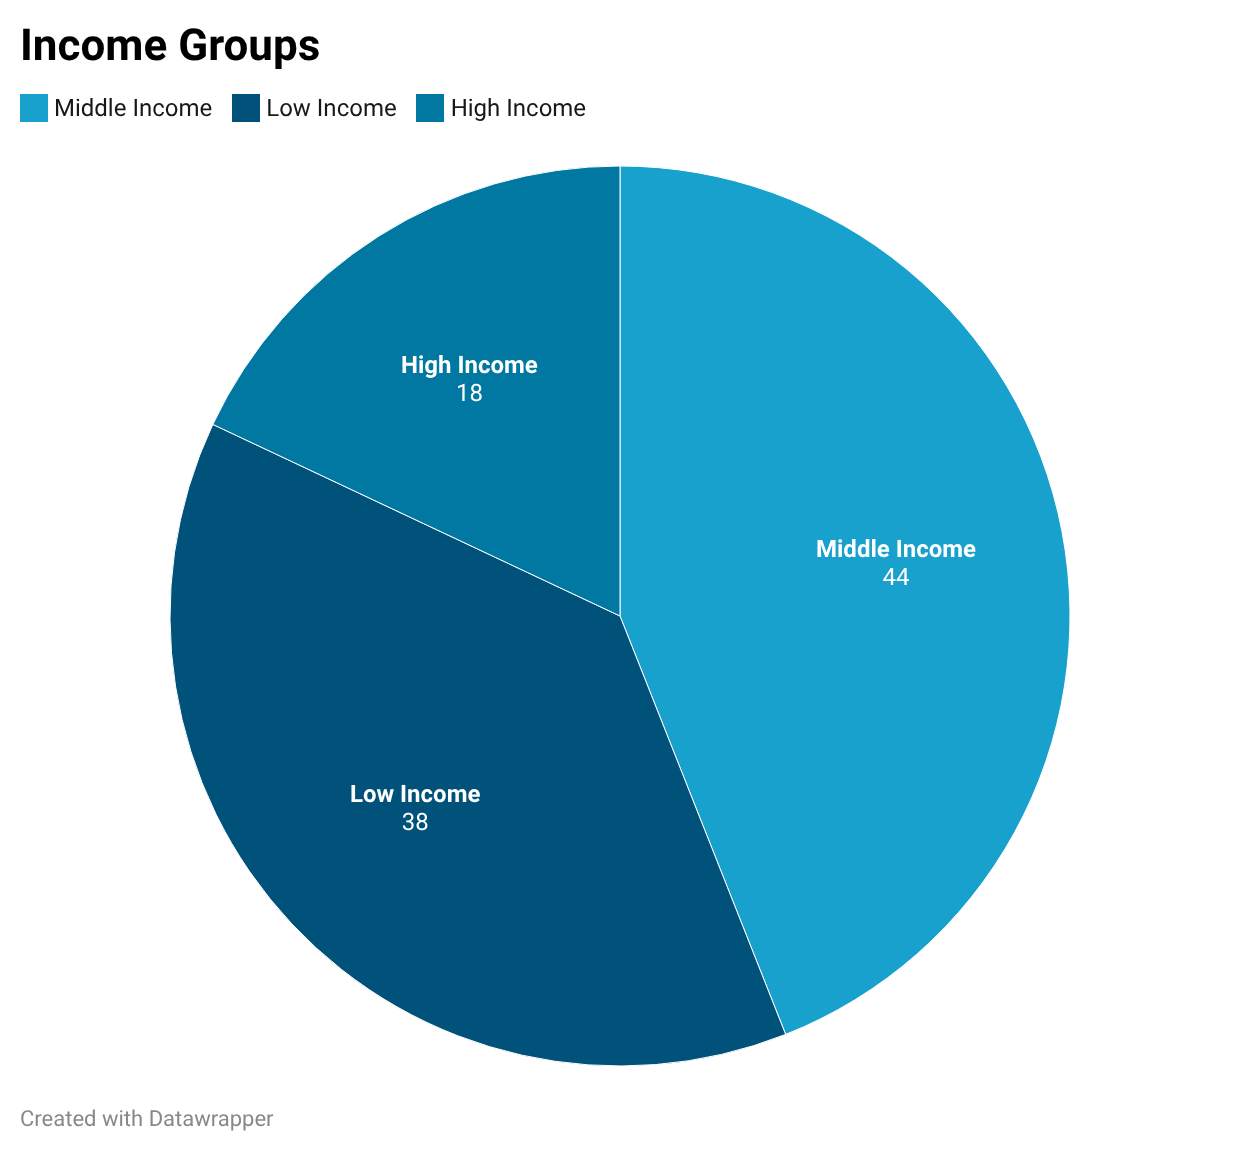
How Data is Used
Building distribution charts, Median Income Comparisons
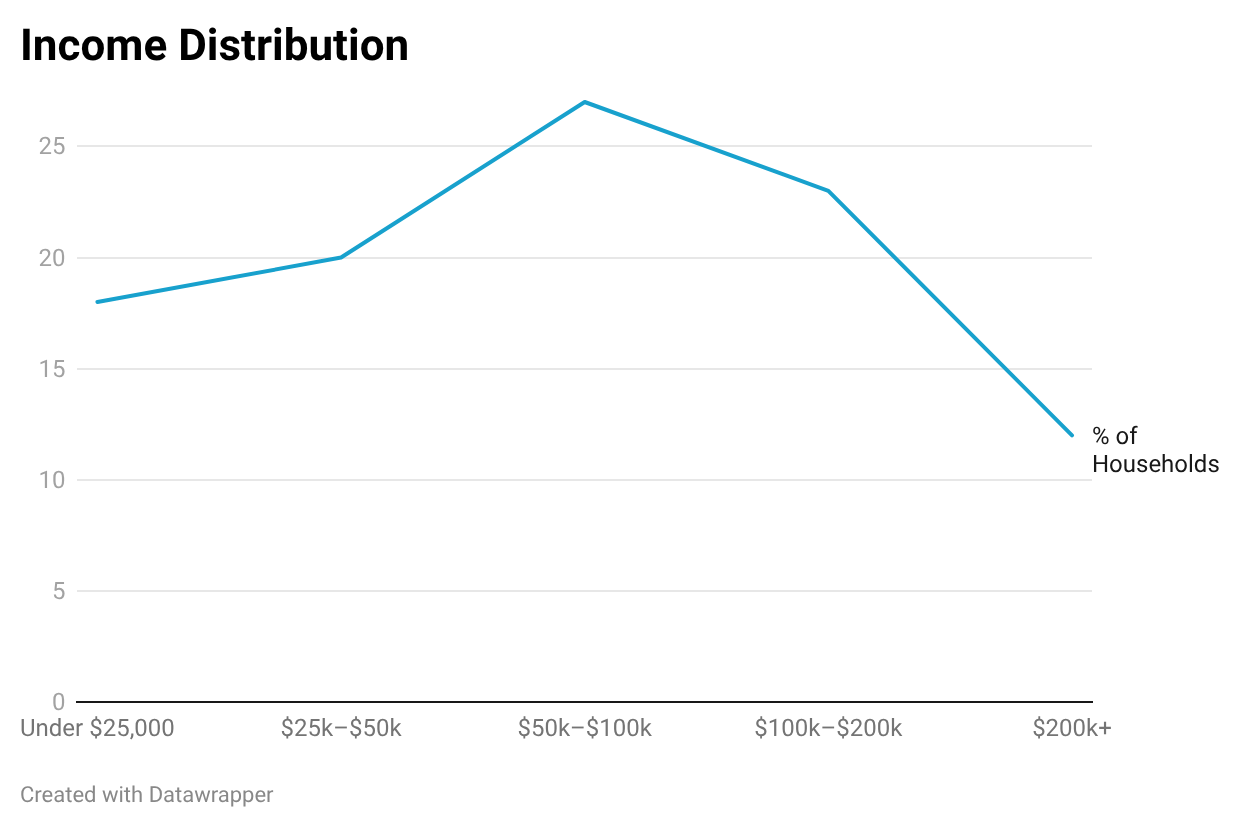
Limitations
Data is not real time, populations may be underrepresented, Local level data can be less detailed and privacy limits how specific the data can be
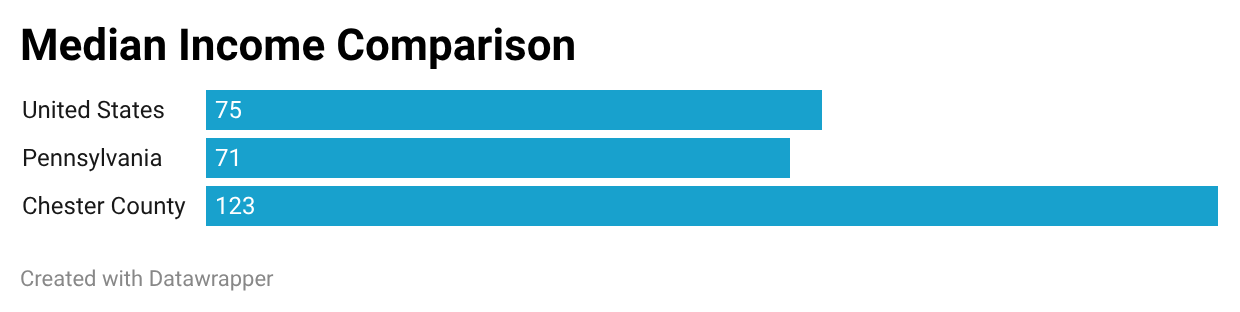
TECH & TOOLS
Used In Project



RESULTS
What the Project Produces
Helps Users better Understand real world economic issues and interpret data visually.
Makes inequality visible and easy to understand, encourages discussion about income, housing and opportunity.
Transforms data into meaningful digital content, makes information accessible to a wider audience, combines technology + research + social impact.
SIMILAR PROJECTS
Focuses on Economic Mobility, Uses Large Scale Data : Visualized Demographic Economic Data